Landlords.co.nz
Property values in the six main centres either flat-lined or declined in July, according to the latest figures from Quotable Value.
To view the regions quickly, use the links below:
QV's Residential Price Index for July shows that property values in the Auckland region have continued to decrease, having now dropped by 0.8% since March this year. In contrast, values increased by 7.8% in the eight months to March.
Consequently, values now sit 6.9% above the same time last year, but 2.5% below the market peak of late 2007 as the graph below illustrates: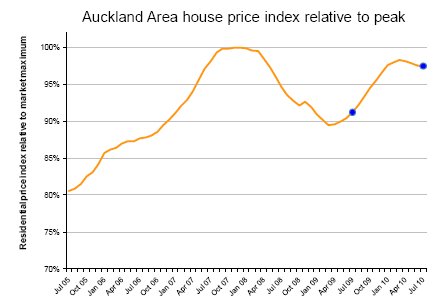
Glenda Whitehead of QV Valuations said: "In Auckland, participants in the market place remain cautious. Since the beginning of this year, there has been neither an overall negative or positive sentiment, more a wait-and-see approach. This has caused a lack of momentum, and as a consequence, values achieved at sale are easing.
"Vendors wanting to sell need to make their properties and their asking prices attractive to potential buyers. Some feedback suggests people are still worried about job security and interest rates rises. Interestingly, those who presently own property are seeking advice about values, before making decisions to sell, hold, renovate or extend their homes.
"Along with most market players' lack of urgency to act, banks appear to be sticking to their tougher lending criteria, including insisting on reasonable deposits or equity levels. This lack of availability of easy credit may also be contributing to the slower momentum felt since the start of this year," Whitehead said.
"In Waitakere, activity is subdued, with sold signs scarce. Properties in lower value, less popular areas appear to be taking a long time to sell. However, in contrast, there is a lack of stock in popular pockets of the residential market on the North Shore, perhaps as potential vendors hold off hoping for a better time to sell. Auckland and Manukau cities show similar buyer and seller patterns to the North Shore," Whitehead said.
QV's Residential Price Index is calculated using sales data from the 3 months leading up to the month being reported. It is not the same as the average sales price, which fluctuates in line with the mix of properties selling in upper or lower price brackets. The average sales price for the Auckland region in July was $539,084.
QV's Residential Price Index for July shows that property values in Hamilton remain relatively stable.
Unlike most other major centres, Hamilton did not continue to experience significant value recovery from mid to late 2009. Subsequently, values are now 0.3% above the same time last year, but 8.7% below the market peak of 2007, as the graph below illustrates:
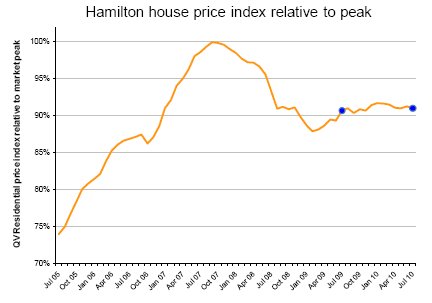
Richard Allen of QV Valuations said: "Residential property values have essentially flat-lined in Hamilton over the past year. Although experiencing a brief recovery from the low point in early 2009, Hamilton has not experienced the market recovery seen in other major centres to March this year.
"It appears that uncertainty in the economic recovery, coupled with the speculation that there will be another increase in interest rates, is continuing to dampen demand and stifle the residential market. This is evidenced by very low sales volumes in the city over the last few months."
QV's Residential Price Index is calculated using sales data from the three months leading up to the month being reported. It is not the same as the average sales price, which fluctuates in line with the mix of properties selling in upper or lower price brackets. The average sales price for the Hamilton region in July was $352,576.
QV's Residential Price Index for July shows that property values in Tauranga remain relatively stable.
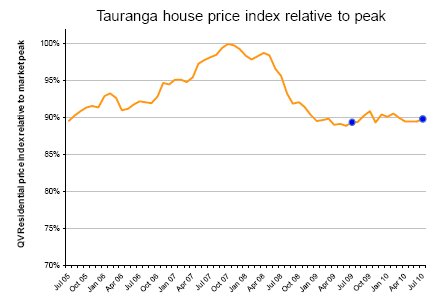
Unlike most other major centres, Tauranga did not see significant value gains in 2009. Subsequently, values are now 0.5% above the same time last year, but 10% below the market peak of late 2007 as the graph below illustrates:
Shayne Donovan-Grammer of QV Valuations said: "Market activity in the Tauranga region is light at present. This is partly due to the season, but current economic conditions are also playing their part. With a reduction in demand, prices are gently easing, not significantly, but certainly enough to be noticeable.
"Some of the potential buyers have been held back to some degree by stricter lending criteria. There continues to be a lack of interest by investors as the current environment is against them with rising interest rates, no immediate prospect for capital appreciation and a lack of incentives and allowances.
"To put the last few years into perspective, from pre-boom to peak, property prices in Tauranga increased by an average of 54%. From the peak of the market to now the market has come back by about 10%. This reinforces that property is a medium to long term investment and can still be an attractive option if managed with this in mind," Donovan-Grammer said.
QV's Residential Price Index is calculated using sales data from the 3 months leading up to the month being reported. It is not the same as the average sales price, which fluctuates in line with the mix of properties selling in upper or lower price brackets. The average sales price for Tauranga in July was $415,971.
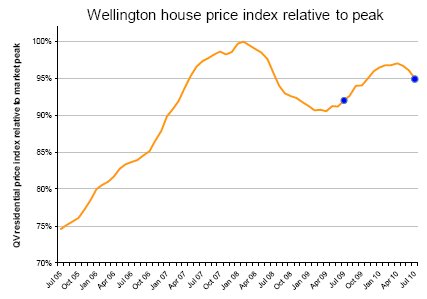
QV's Residential Price Index for July shows that property values in the Wellington region have continued to decrease, having now dropped by 1.9% since March this year. In contrast, values increased by 5.2% in the eight months to March.
Consequently, values now sit 3.2% above the same time last year, but 5.0% below the market peak of early 2008 as the graph below illustrates:
Kerry Buckeridge of QV Valuations said: "The Wellington market is currently very slow. As our latest statistics show, the trajectory of Wellington values over the last six months has been downward, and our gut feel on the ground supports this.
"There is little market activity from either buyers or sellers. Early in the year a flood of listings hit the market which resulted in supply outstripping demand.
"Subsequently, some of this excess stock has moved, however, this does not appear to have bolstered the market in any way. Real Estate agents report both listing and sales activity to be rather slow," Buckeridge said.
"Sellers appear to be avoiding listing properties unless they really have to, while buyers are proving to be hard to motivate into action. Many potential purchasers watch the market for months before making a move, and when they do, they avoid properties which have negative characteristics. We are also hearing that banks are being very cautious. New home buyers in particular need a substantial deposit and a good banking history if they are to be approved for mortgage finance," Buckeridge said.
"As in any market, we are also hearing of isolated transactions apparently going against the broader trend. In such cases these properties achieve multiple offers and sell for good prices. Inevitably these are properties with features enabling them to stand out from the crowd and hence spark the interest of buyers," he said.
QV's Residential Price Index is calculated using sales data from the three months leading up to the month being reported. It is not the same as the average sales price, which fluctuates in line with the mix of properties selling in upper or lower price brackets. The average sales price for the Wellington region in July was $457,472.
QV's Residential Price Index for July shows property values in Christchurch have continued to be stable. They have now been relatively steady since February, after increasing since early 2009.
Consequently, values now sit 4.6% above the same time last year, and 3.0% below the market peak of 2007 as the graph below illustrates:

Melanie Swallow of QV Valuations said: "House prices have remained fairly static in Christchurch for the past six months. The signs of a more traditional, seasonally influenced market are beginning to emerge, with what appears to have been a correction in the entry-level part of the market.
"The growth experienced from July 2009 to January 2010 was largely fuelled by pressure in the entry level part of the market being driven by a shortage of stock as vendors sat on their hands. In that period, some very good sale prices were achieved, particularly through the auction process. As more listings came to market this situation dissipated, which is seen in the beginning of the flat line in house values," she said.
"Anecdotal comments from agents and bankers are that properties are taking longer to sell, with no-price-marketing a common theme. There still appears to be some disparity between vendors and purchasers, with the reduction in asking prices being made by vendors still not enough to hook purchaser dollars. Some would-be purchasers also struggle to get finance," Swallow said.
"The upper end of the market is very static, with low sales volumes and depressed prices. The cost to build a million dollar home is often outweighing its market value. There are two drivers behind this. First, the amount of choice and variety available for sale in Canterbury in this segment of the market is limited, and second, softer demand means few purchasers are trading up. We expect this to improve, but not in the immediate future. The lifestyle sector also remains flat to date," Swallow said.
QV's Residential Price Index is calculated using sales data from the 3 months leading up to the month being reported. It is not the same as the average sales price, which fluctuates in line with the mix of properties selling in upper or lower price brackets. The average sales price for Christchurch in July was $365,304.
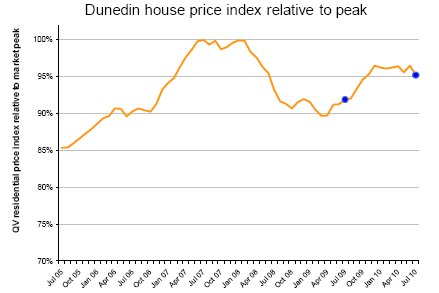
QV's Residential Price Index for July shows that property values in Dunedin have decreased, having now dropped by 1.1% since March this year. In contrast, values increased by 4.7% in the 8 months to March.
Consequently, values now sit 3.7% above the same time last year, but 3.9% below the market peak of 2008 as the graph below illustrates:
Tim Gibson of QV Valuations said: "The Dunedin property market has continued to slow in the month of July. Local real estate agents are also reporting a decrease in the activity of interested parties during recently held open homes within Dunedin city. This is typically for the lower to mid value bracket properties.
"Existing home owners are the most dominant player in the market at present, with a higher than usual number involved in transactions recently. A current over-supply of stock prevails in Dunedin, due to the low volume of active and potential purchasers. For those in a strong financial position, it can be been seen as a good time to upgrade due to greater bargaining power on the buyer side," Gibson said.
"There also appears to be a drop in interest shown by first home buyers. The reason for this can be put down to a wait-and-see approach, as well as some difficulty in raising the required finance to purchase. Some potential purchasers have no doubt been put off by pending interest rate increases," he said.
QV's Residential Price Index is calculated using sales data from the three months leading up to the month being reported. It is not the same as the average sales price, which fluctuates in line with the mix of properties selling in upper or lower price brackets. The average sales price for Dunedin in July was $273,719.
Source: Landlords.co.nz
Need help or
support?